Data Visualisation – The Sentry
Report design, maps and data graphics for investigations into the illicit financial flows behind conflict.
About the project
The project
The Sentry is an investigative and policy organisation that follows the networks profiting from violent conflict, repression and kleptocracy. Its reports, on the Libyan Investment Authority, Eastern Libya's financiers and its own annual impact, are read by regulators, prosecutors and journalists.
My contribution
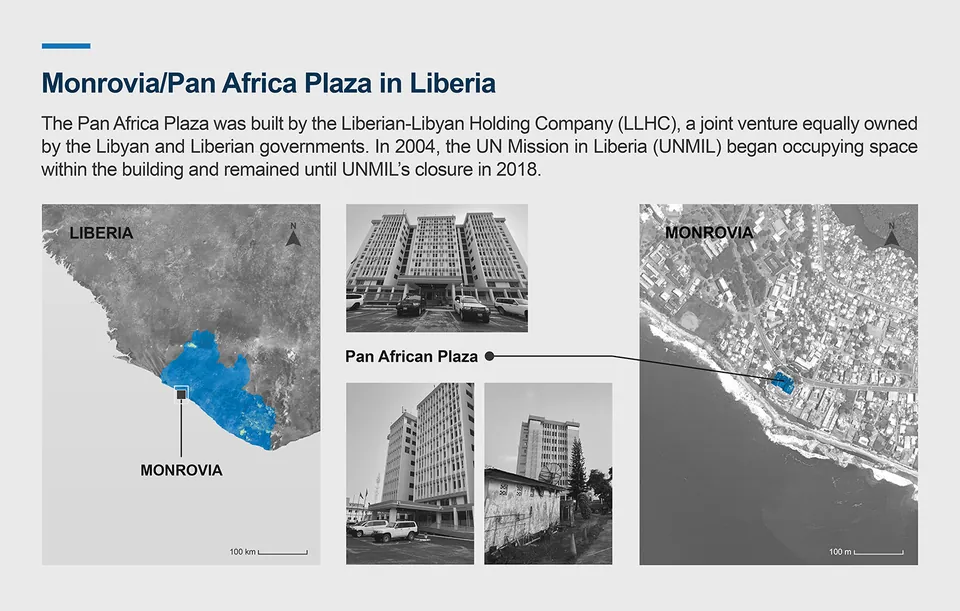
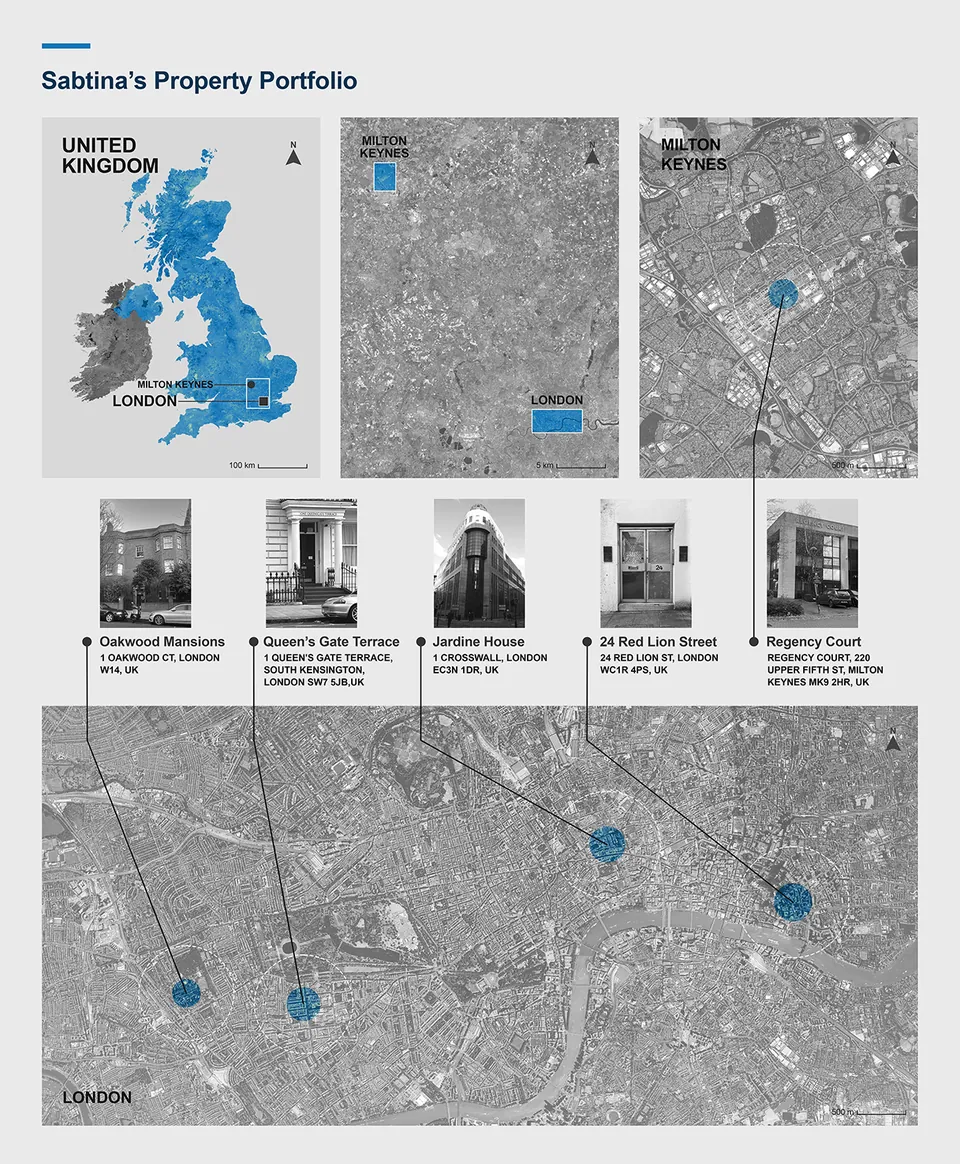
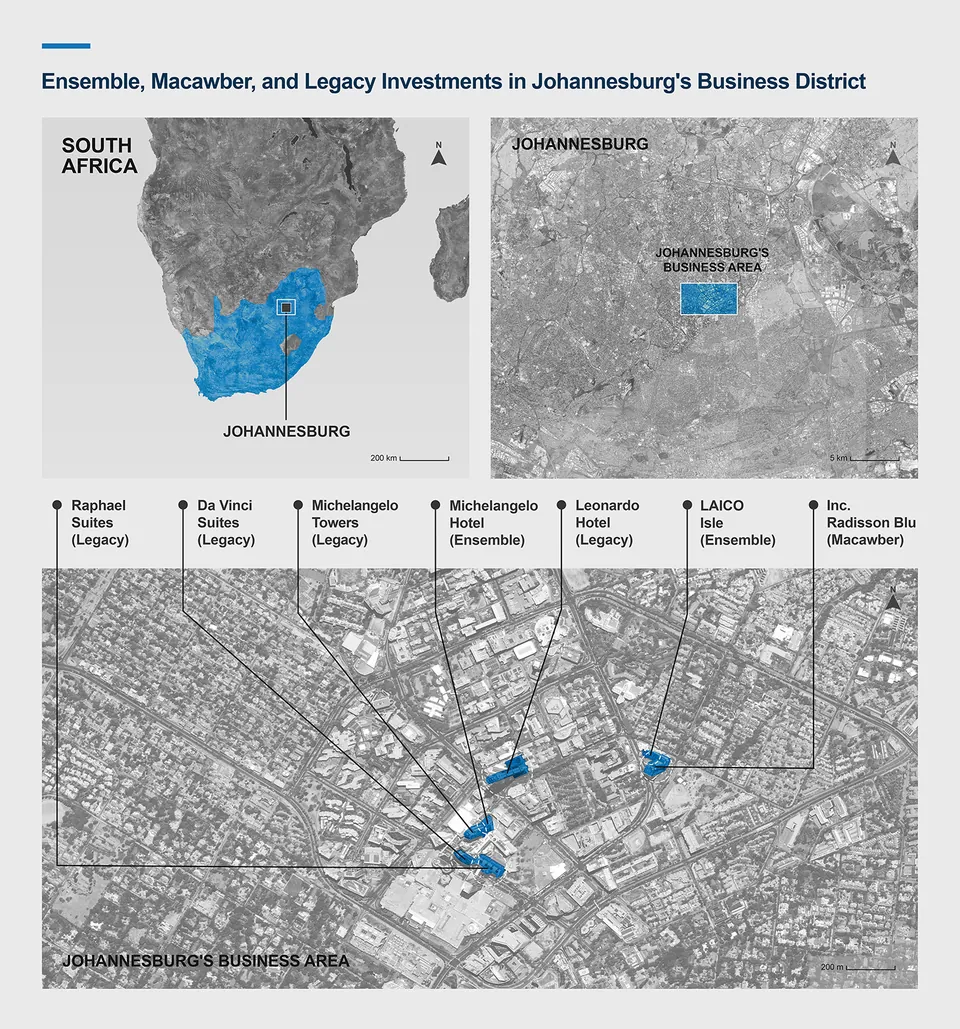
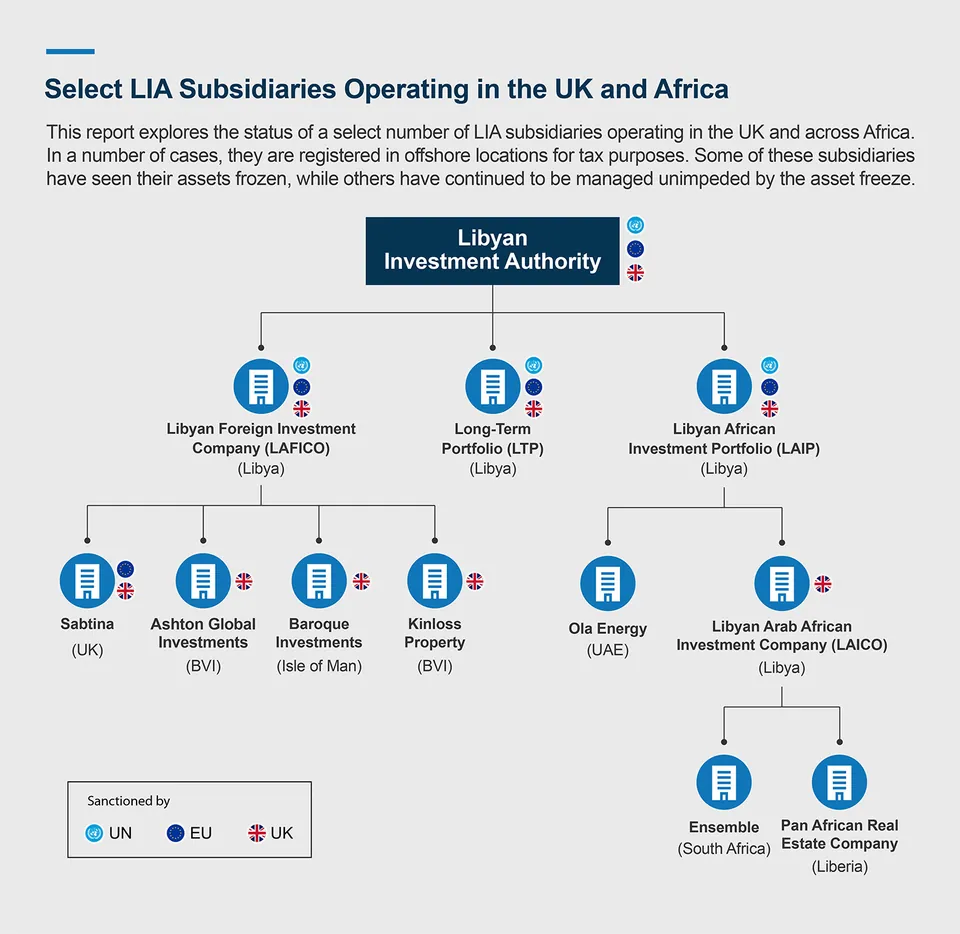
I design and format the investigative reports and their digital assets: covers, property and asset maps, corporate-ownership diagrams, charts, animated social graphics, and reusable templates and asset libraries for the team.
The work